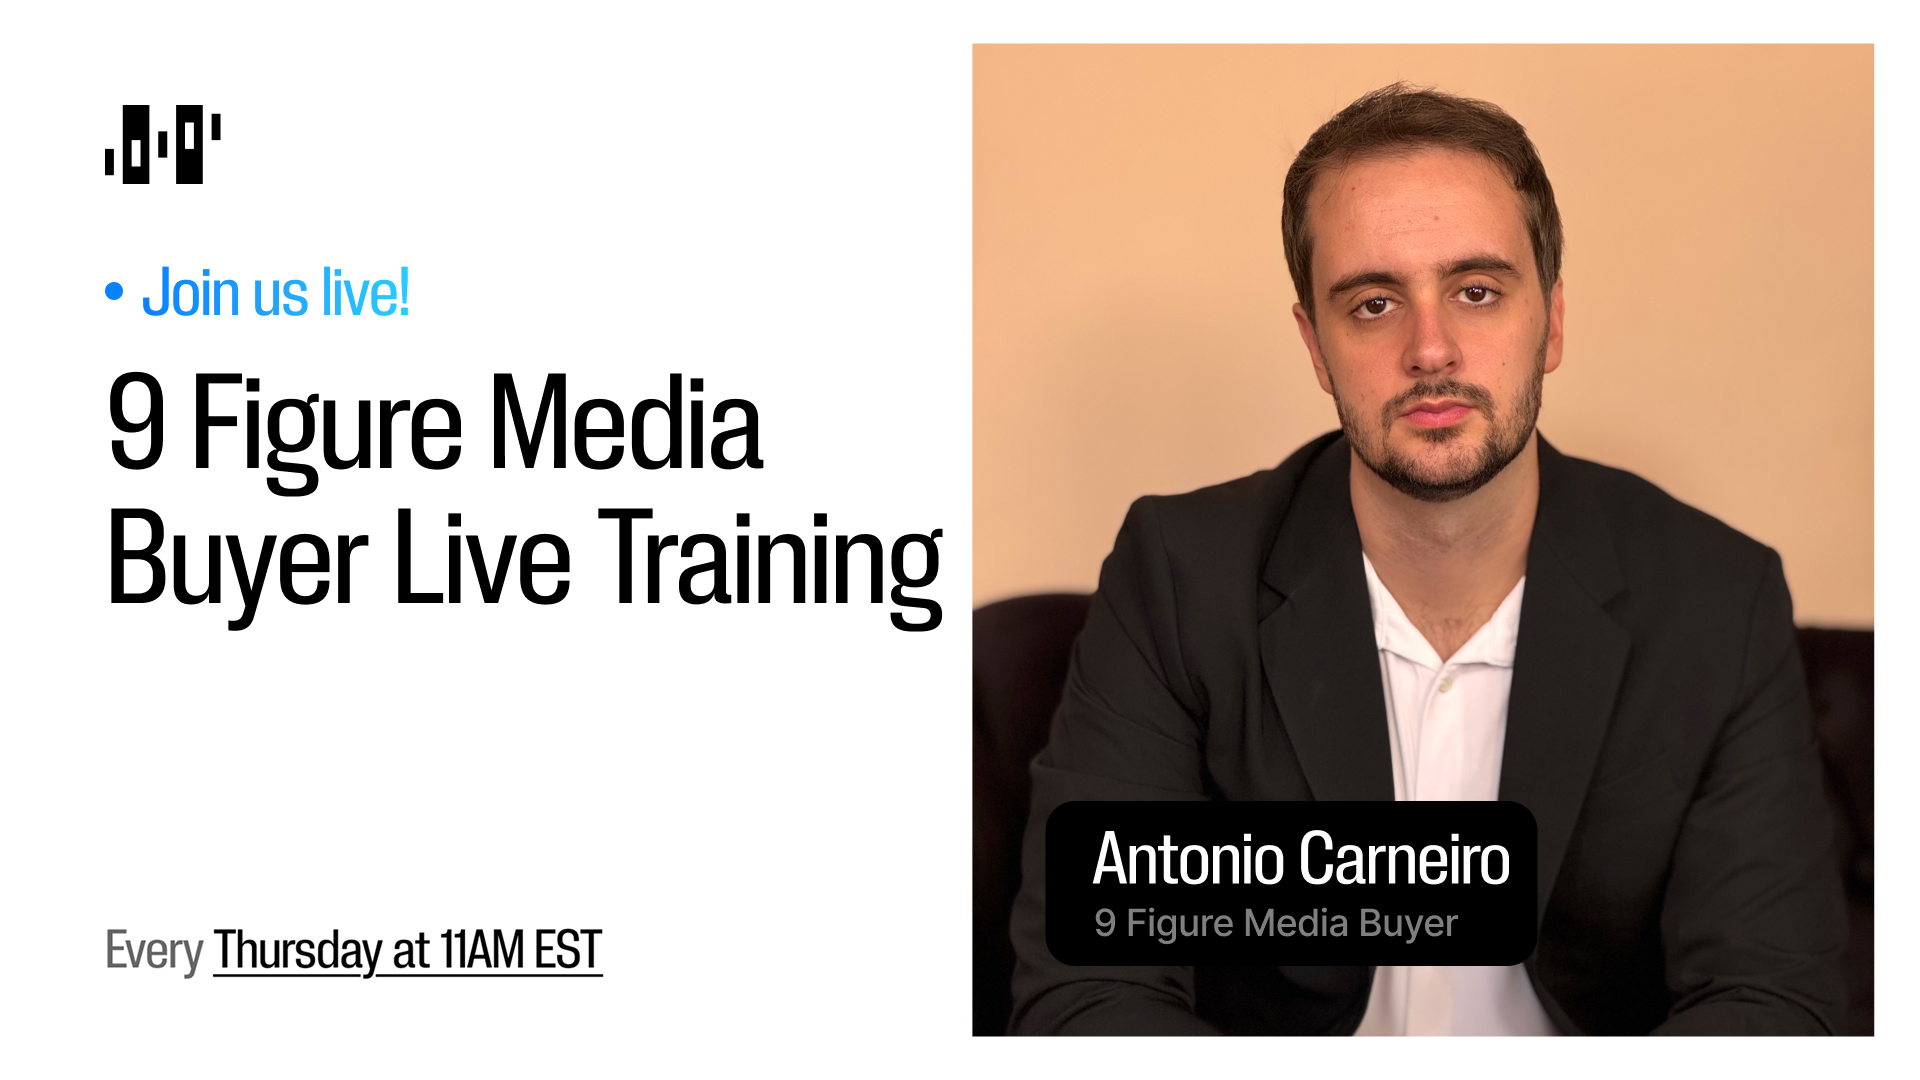
Antonio Carneiro pulled up his HYROS Creative Report live on Thursday. He took questions from the room and worked through the reads most operators get wrong on their own creative. Antonio has managed $350M in ad spend and generated $700M in revenue. He went deep on:
Which creatives to cut when the platform says they're winning
The hidden HYROS filter that aggregates by your naming convention
How one variation can fake a whole concept's ROAS
Reading each metric on the timeframe that actually fits
Turning the HYROS report into a two-minute AI pattern-read
Our notes below: 1. The ad that only looks like a winner (17:39) Your ad platform shows a creative clicking cheap, so you scale it. Antonio pulls cost per click first and trusts it least. Cheap clicks can be the wrong people, and expensive ones can be the right buyers. His real read runs down the funnel: cost per lead, then cost per acquisition, then ROI, cutting anything past 2x the target. Your ad platform sees the click. It can't see the sale. HYROS tracks it to revenue. 2. The HYROS filter almost nobody uses (15:02) Most people read the creative report one ad at a time and miss the pattern sitting across dozens of them. There's a search filter built into every HYROS performance report that almost no one touches. Type any tag from your naming convention, a concept, an angle, a format, and it pulls every campaign, ad set, and ad carrying that tag into one aggregated read. Now you judge a whole concept, not a single ad. Your ads manager can't group by your naming convention. This HYROS filter can. 3. The average that hides your real winner (42:21) A concept was averaging strong ROAS all week and looked ready to scale. The average was the trap. Antonio read the variations underneath it and found one running 11 to 12x, carrying the entire concept. He scales that variation, not the concept. A blended average hides the real winner. HYROS lets you read down to the variation that actually earned the money. 4. Match each metric to its conversion cycle (22:11) Most operators read every metric on the same 7-day window. Antonio matches the window to how long the buy actually takes. A $27 front-end offer where most people buy within a day, he reads daily. High-ticket ROAS is a lagging indicator that needs about two weeks to mean anything, so he reads it across 14, 30, and 90 days. Read a slow metric on a fast window and you cut winners before they ever convert. HYROS keeps the full history, so you pull the same creative across any timeframe and see the real trend. 5. Turn the report into a two-minute AI pattern-read (07:11) You don't need an automation for this. Antonio screenshots his HYROS Creative Report and asks Claude to find the naming-convention and ROAS patterns. Two minutes, no build. Even a scattered naming convention surfaces patterns: Claude flagged that his iterated creatives kept winning. One caution, though. AI finds the correlation, not the reason, so a full-stack read still matters. The pattern-read is only as sharp as the data behind it, and HYROS feeds Claude sale-tracked numbers, not the platform's guess.
Not every winning ad is actually winning. Your best-looking creative isn't always your best-performing one. This Thursday, Antonio Carneiro goes live. He opens his HYROS Creative Report and shows how to tell a real winner from an ad that only looks like one. He reads the data. He makes the call on what to scale and what to kill. Antonio has managed $350M in ad spend and generated $700M in revenue. You've got the creative data. Reading it right is the hard part. He's breaking down the full workflow:
The Creative Report he opens first, and how he reads it
The naming convention that makes his creative data easy to sort
How to spot the ad that looks like a winner but is quietly losing money
How he feeds that creative data into AI for a clean kill vs. scale call
👉 Register free: Thursday at 11AM EST New link this week. Even if you've joined before, register once here and you're set for every session after. – The HYROS Team